
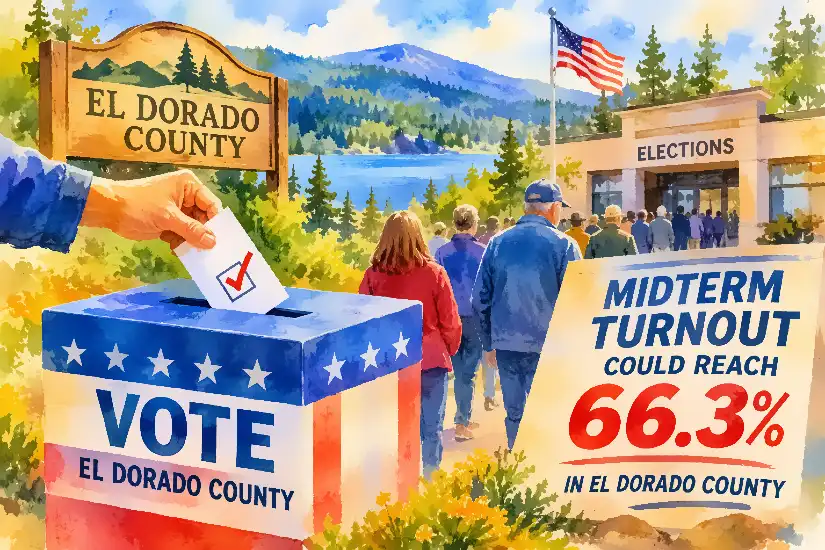
El Dorado County Midterm Turnout Could Reach 66.3% as Ballots Await Processing
EL DORADO COUNTY, Calif. — The first unprocessed-ballot report following the Nov. 3 general election suggests El Dorado County could be experiencing a substantially higher midterm voter turnout than its historical average.
Figures attributed to the El Dorado County Elections Department show 69,706 ballots have been processed, while another 21,711 remain unprocessed. If every outstanding ballot ultimately qualifies for counting, the county could have as many as 91,417 ballots included in the election totals.


Using an estimated eligible-voter population of 137,930, that potential total translates into a turnout rate of approximately 66.3%.
That would represent a significant increase over the approximately 54% historical midterm average cited for El Dorado County. It would also suggest that local issues and closely contested races may have played a substantial role in motivating residents to participate.
Competitive local races may have helped drive turnout
Two contests in particular attracted considerable local attention: the race for El Dorado County Board of Supervisors District 4 and Measure S.
The District 4 supervisor contest placed local leadership, county priorities and the direction of future policymaking before voters. Measure S, meanwhile, brought local taxation, public services and government spending into the election debate.
Both contests generated considerable public discussion, giving residents reasons to pay attention beyond the statewide and national races appearing on the same ballot.
Although it is too early to establish how much either contest contributed to voter participation, competitive local elections can encourage voters who might otherwise skip a midterm election to cast a ballot.
For a county where local government decisions directly affect land use, public safety, roads, taxation and community services, those issues can carry considerable weight.
Historical turnout provides perspective
El Dorado County has historically demonstrated relatively strong voter participation compared with many California counties.
A December 2022 analysis by The Sacramento Bee, using eligible-adult turnout figures, reported that approximately 62% of eligible voters participated in the 2022 midterm election. That exceeded the county’s approximately 54% average across the preceding eight elections.
The county also recorded a 72.8% turnout rate among registered voters in the November 2010 general election, according to historical voter participation statistics compiled from California Secretary of State data.
The historical figures nevertheless demonstrate that El Dorado County voters have a record of participating at relatively high rates, particularly when elections generate substantial public interest.
More than 21,700 ballots remain in the process
The current figures are promising for those watching voter participation, but they do not represent a final turnout determination.
The 21,711 outstanding ballots must still move through the Elections Department’s processing and verification procedures. Some ballots may not qualify for counting, and the final number will depend on the department’s review.
California’s election process includes verification procedures intended to ensure that only eligible votes are included in certified results. These procedures can involve signature verification, provisional-ballot review and the resolution of ballot issues.
Consequently, adding every outstanding ballot to the processed total provides a potential turnout ceiling based on the reported figures, not a guaranteed final result.
The distinction matters. A preliminary estimate of 66.3% should not be reported as the county’s actual turnout until the canvass is complete.
December 3 is the deadline for final certification
El Dorado County’s Elections Department says unofficial results will continue to be published after Election Day, with subsequent reports issued twice weekly until ballots have been tabulated, excluding ballots awaiting signature cures.
December 3, 2026, is the statutory deadline for counties to complete their official canvass and certify election results. The California Secretary of State is scheduled to certify statewide results on December 11.
For El Dorado County residents, the coming weeks will provide a clearer picture of both the final election outcomes and the level of participation generated by this year’s contests.
If the outstanding ballots are largely validated and counted, the county could finish with turnout approaching 66.3% — a notable result for a midterm general election.
For now, the first unprocessed-ballot report offers an encouraging indication of civic engagement, but the final numbers will have to wait until the Elections Department completes its work.
The ballots have been cast. The counting continues. And El Dorado County’s final turnout story is still being written.
Sources and supporting records
-
El Dorado County Elections Department — November 3, 2026 Election Results. Official reporting schedule and canvass information.
-
South Tahoe Now — Next El Dorado County ballot count expected Thursday at noon. Nov. 4-5 reporting on preliminary ballot counts and subsequent updates.
-
The Sacramento Bee — See voter turnout in your community and across the Sacramento area. Historical midterm participation comparison.
-
El Dorado County Economic and Demographic Profile. Historical county voter participation statistics.
-
California Secretary of State — November 3, 2026 General Election. Statewide ballot-counting and certification deadlines.
-
California Voter Foundation — Close Count Transparency Project. Explanation of outstanding-ballot estimates and why they change during the canvass.
Election reporting schedule
The county’s published election-results page states: “Following Election Night, results will be reported twice per week until all ballots, aside from ballots awaiting signature cures, have been tabulated.”
The Secretary of State confirms Dec. 3 as the deadline for county certification.
Historical turnout clarification: The 54% benchmark is supported by The Sacramento Bee’s comparison of El Dorado County’s previous eight elections. Its 2022 analysis reported approximately 62% eligible-voter turnout in that year’s midterm. The 2010 figure of 72.8% refers to registered-voter turnout, not eligible-population turnout