LOTUS, Calif. — A newly circulated memorandum from local political consultant Dan Dellinger is challenging long-held assumptions about voter registration advantages in California’s 3rd Congressional District, suggesting the race may be far more competitive than conventional analysis indicates.
In a March 27 memo addressed to “interested persons,” Dellinger argues that traditional calculations—comparing only Democratic and Republican registration—fail to account for the influence of minor political parties. Standard figures show Democrats holding a 7.25 percentage point advantage over Republicans in CD3, with 38.77% to 31.52%, respectively.


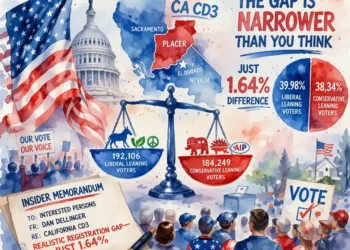
However, Dellinger’s analysis reframes the data by grouping minor parties along ideological lines. By combining Democrats with Green and Peace & Freedom party registrants, and Republicans with Libertarians and the American Independent Party, the gap narrows significantly.
According to the memo, liberal-leaning voters total 192,106 registrants, or 39.98%, while conservative-leaning voters account for 184,249 registrants, or 38.34%. That leaves a difference of just 1.64 percentage points.
“Conventional wisdom is only viewing this race through the prism of just Democrats versus Republicans,” Dellinger wrote. “If we take into consideration the past history of minor parties… the equation changes.”
The analysis draws from voter registration data across four counties within CD3—El Dorado, Nevada, Placer, and Sacramento—regions that collectively shape the district’s political landscape. El Dorado County, in particular, shows relatively close alignment between major party registrations, reinforcing the broader conclusion of a competitive electorate.
Dellinger also addressed the role of No Party Preference (NPP) voters, who make up more than 20% of registered voters in the district. He noted that NPP voters tend to mirror local voting trends but are less consistent in turnout, particularly during primary elections or in highly contentious races.
“NPP voters do not like conflict,” the memo states, adding that heavy negative campaigning may suppress participation or lead to undervoting in specific contests.
Local political observers note that while the methodology offers a different lens, its conclusions depend heavily on assumptions about how minor party voters align ideologically—an area that can vary significantly by election and candidate.
Still, the memo arrives as candidates and parties begin positioning for the 2026 election cycle, where turnout dynamics and voter engagement are expected to play a decisive role in closely contested districts like CD3.
INSIDER Memo distributed 3-27-2026
Dan Dellinger Consulting
P.O. Box 638
Lotus, CA 95651
Phone (530) 644-5663
dandellinger@infostations.com
Insider Memorandum: 3-27-26
TO: Interested Persons
FR: Dan Dellinger
RE: California CD3 Realistic Registration Gap – Just 1.64%
I just ran the party registration numbers on CA CD3 and here is how I see Republican
chances versus how conventional wisdom perceives them. Conventional wisdom is only
viewing this race through the prism of just Democrats versus Republicans, as if minor
parties do not affect the outcomes of elections, Democrats 38.77% minus Republicans
31.52% yielding a D + 7.25 registration advantage making it look like a big reach for a
Republican. However, if we take into consideration the past history of minor parties with
respectable registration numbers in Northern California, the equation changes to Liberal
Voters minus Conservative Voters equals the realistic registration advantage, or
(Democrats + Green + Peace & Freedom) – (Republicans + Libertarians + American
Independent Party) = Realistic Registration Advantage.
Liberal Leaning Voters
Democrat P&F Green
El Dorado 11,252 195 273
Nevada 30,204 391 724
Placer 25,603 293 424
Sacramento 119,250 1,897 1,600
Total 186,309 2,776 3,021
38.77% 0.58% 0.63%
Conservative Leaning Voters
Republican Libertarian AIP
El Dorado 10,066 625 2,064
Nevada 25,552 1,301 4,450
Placer 39,317 1,738 4,925
Sacramento 76,542 3,690 14,009
Total 151,447 7,354 25,448
31.52% 1.53% 5.30%
Liberal Leaning Voters Conservative Leaning Voters
Democrat 186,309 Republican 151,447
P&F 2,776 Libertarian 7,354
Green 3,021 AIP 25,448
192,106 184,249
39.98% 38.34%
Page 2 of 2
Thus 39.98% – 38.34% = 1.64%, a slim registration advantage in Liberal Leaning Voters
within CD3.
I highly recommend that we correct the outcome advantage assumption being pushed by
liberal pundits designed to suppress Conservative voter turnout and our ability to raise
funds for Republican candidates up and down the ballot.
I did not include No Party Preference (NPP) voters in this discussion because they are not
usually grounded in any political ideology and tend break out the same way as their local
community. NPP voters do not like conflict. If there is heavy negative advertising in a
contest, NPP voters also tend to drop off of voting in that contest and leave it blank on
their ballot (the undercount) or do not vote. In addition, NPP voters do not turnout well in
Primaries but will vote in General Elections if they are interested in a candidate or ballot
measure.
Members of the other miscellaneous parties tend to hold viewpoints on the fringe of
normal political discourse or view politics as a comedic theater.
NPP Other Parties
El Dorado 6,688 324
Nevada 15,091 465
Placer 16,622 997
Sacramento 61,678 2,320
Total 100,079 4,106
20.83% 8.06%